
Fast plotters for large amounts of data
Meaningful plots are necessary to understand the data. Starting with time series, over histograms and transformations, up to more complex plots, many important properties of the data can be visualized.
In many cases the standard programs are sufficient for plotting, for example gnuplot, Matlab/octave or Python. However, if large amounts of data have to be processed for the plot, if the program needs to offer certain functionalities or if the plot routine needs to be integrated into an existing software framework, a modular, efficient routine or program tailored directly to the problem is recommended.
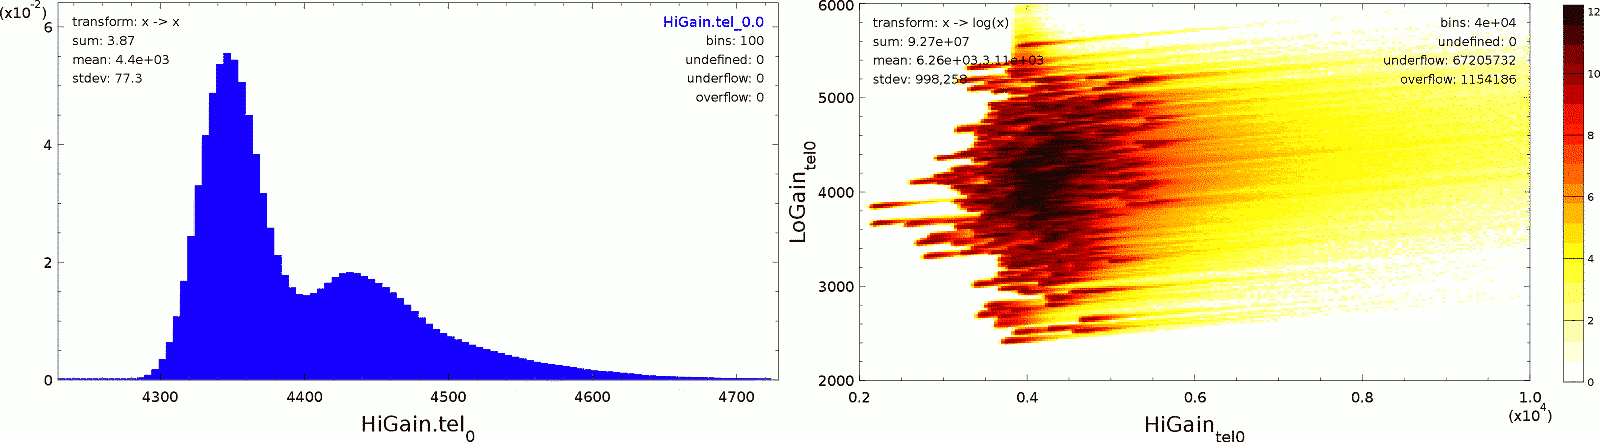
Example: 1D and 2D plotter
Here, the output of a plotter is shown that generates and displays one- or two-dimensional histograms from n-dimensional data sets. It is fast and can also be run through an SSH tunnel on a remote computer. Commands for changing the display and exploring the data can be sent via keyboard shortcuts or an integrated command line.
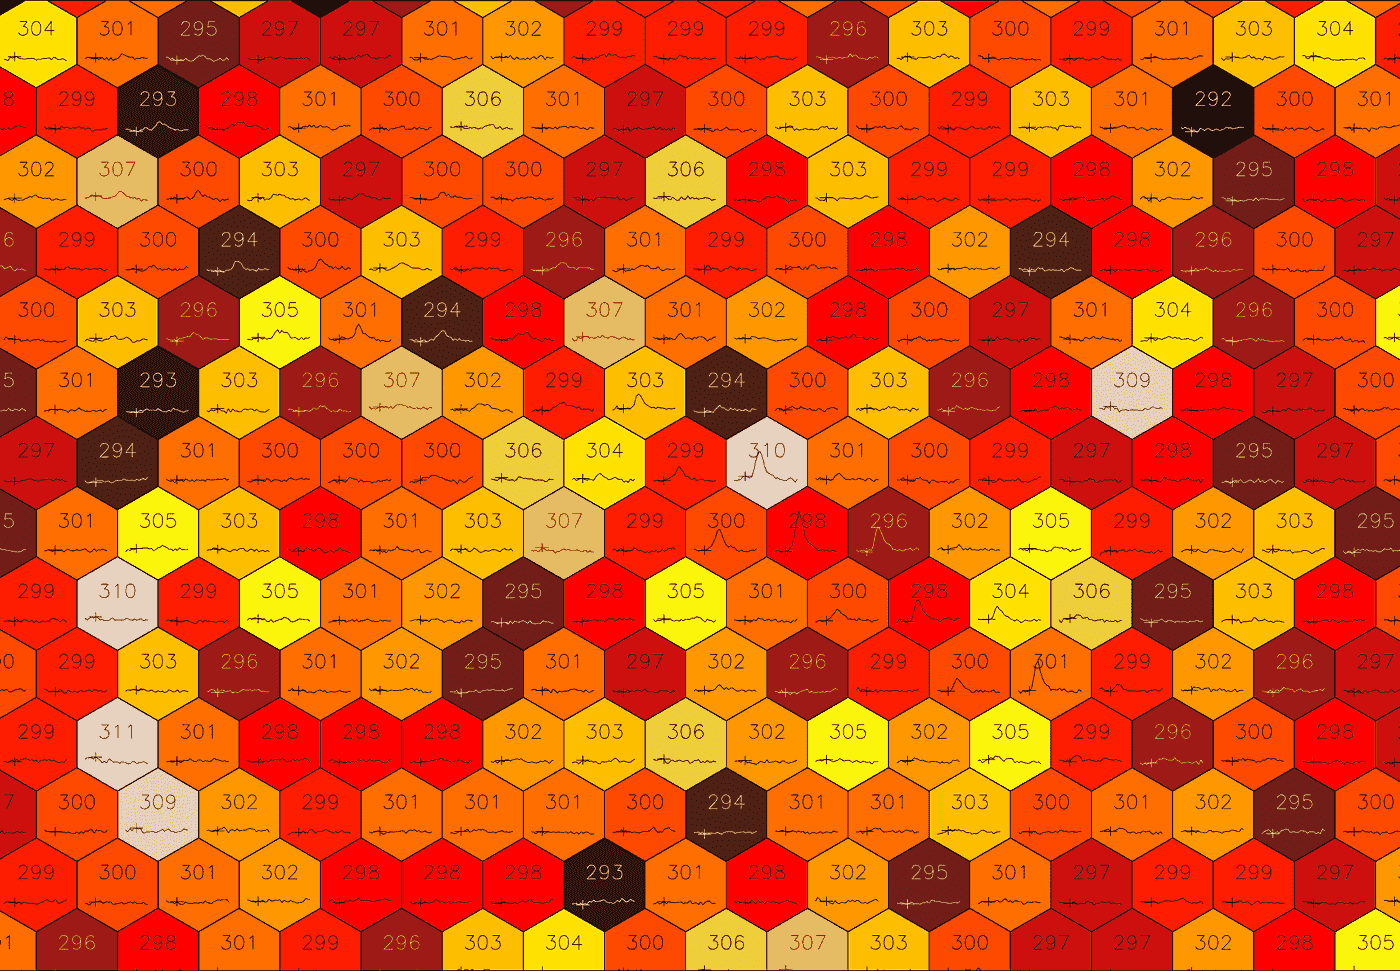
Example: Plotter for complex data of a gamma telescope from CTA
Here the output of another plotter is shown, which has been developed for displaying Cherenkov camera images.
Contact
An efficient plotter, tailored to the data, can be developed on request.